A Brief Tour of Sterling
Welcome to Sterling! On this page, we give a brief introduction to the Sterling user interface. After taking this tour, you'll know how to navigate the views provided by Sterling and you'll be ready to explore some of the more in-depth features and settings on your own.
# Alloy
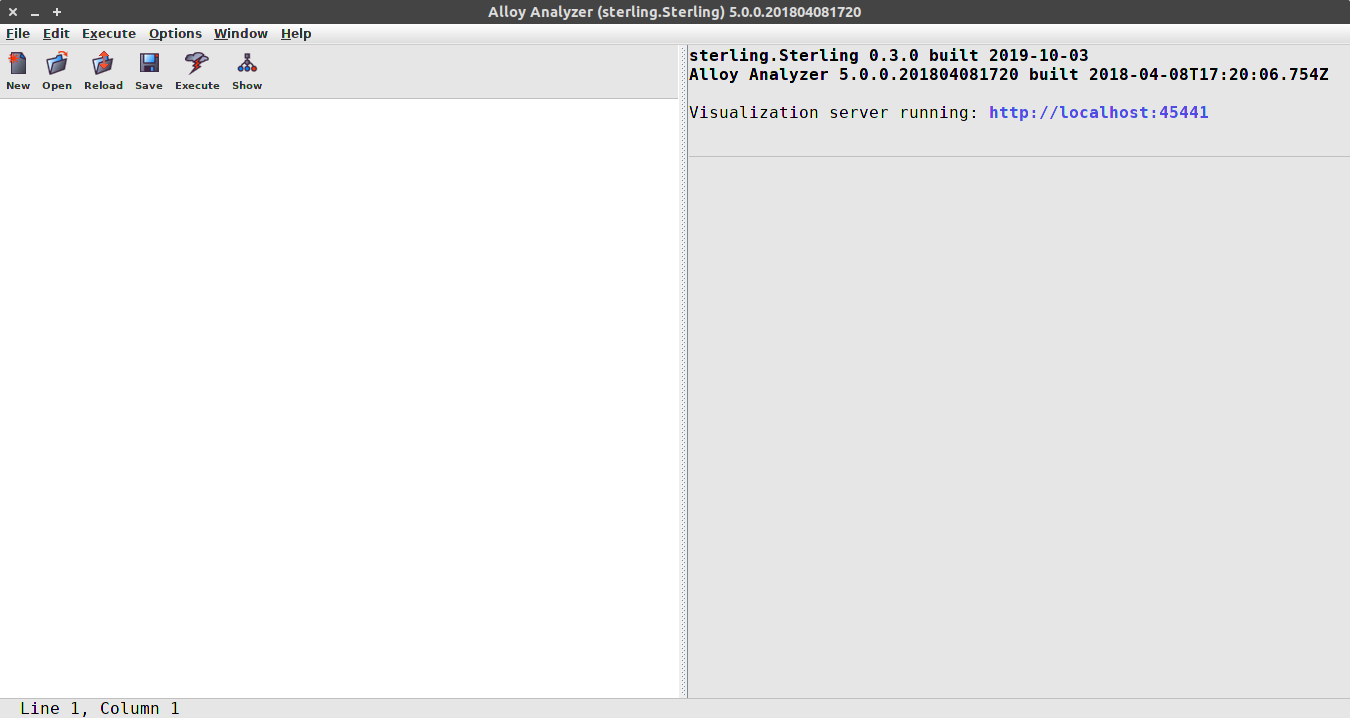
Sterling is a web-based visualizer for Alloy, providing enhanced graph and table views in an effort to make instances easier to explore and understand. It is built on top of Alloy 5.0.0.1, making only two small additions to the Alloy interface in order to support connection to the browser. When Alloy Sterling is first launched, you are given a link that will open Sterling in your default browser. Additionally, a "Web" button that does the same has been added to the Alloy visualizer.
Alloy is unchanged aside from these two additions, and using Sterling to visualize instances is entirely opt-in.
# Sterling
To Alloy users, Sterling will likely feel very familiar. The interface draws inspiration from Alloy, and many of its features have been migrated to Sterling. Much like the built-in Alloy visualizer, Sterling displays only a single instance at a time.
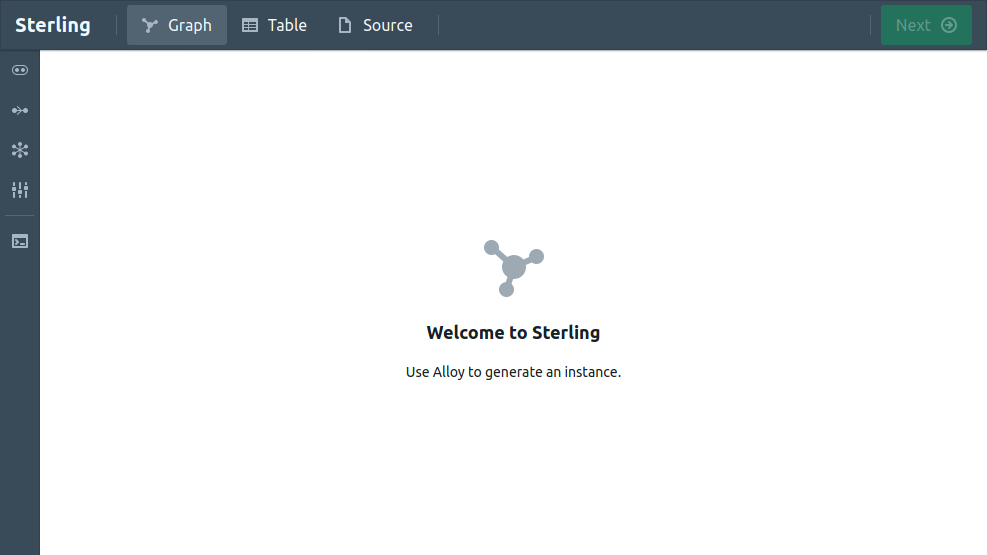
You are provided with three views — Graph, Table, and Source — that are accessible from the navigation bar at the top of the window.
- Graph - A directed graph view of the instance
- Table - A set of tables showing all sets and relations in the instance
- Source - All source code files used to generate the instance
The Next button at the right side of the navigation bar can be used to generate and display the next solution.
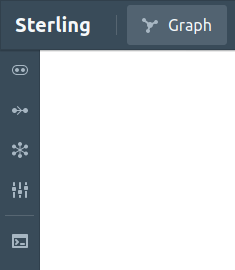
The sidebar, on the left edge of the screen, contains buttons that will open a drawer which contains tools or options. The buttons above the divider are specific to the currently active view — Graph in the following image — and those below the divider are tools that are available regardless of the currently active view.
Let's take a look at what each view has to offer, starting with the Graph view.
# The Graph View
The graph view displays the current instance as a directed graph, and provides a lot of the same functionality as the Viz tab in Alloy. For example, projections are fully supported and relations can be viewed as attributes. Additionally, graph nodes are draggable and the view can be panned and zoomed. The following video gives a brief tour of some of the basic functionality in the Graph view (hover over the video to show controls — full screen is available).
Compared to the Alloy visualizer, there are a few key differences in the graph view, all of which are demonstrated in the video above.
- Node placement is not limited to rows and so you are free to drag them anywhere in the graph.
- The layout is not updated by default when a projection or instance is changed.
- A handful of additional layout methods are provided, and you may apply them at any time.
The sidebar buttons for the Graph view are as follows:
-
 — Projections and Node Styling
-
 — Edge Styling
-
 — Layout
-
 — Graph Settings
-
 — Evaluator
# The Table View
The Table view displays the signatures, fields, and skolems of the current instance as a set of tables. Advanced sorting and filtering options make it easy to explore the instance and find the specific data you're looking for. Furthermore, Sterling introduces the ability to highlight skolemized variables, as shown in the video below.
# The Script View
The script view provides an environment for the development of custom visualizations by bringing together a text editor, and blank canvas, and a JavaScript execution environment. This gives you a basic "code sandbox" in which you can create visualizations based on instance data using your favorite JS libraries.
Within the script view environment, all instance data (the signatures, fields, atoms, and tuples) are exposed as JS variables. Furthermore, you have direct access to the npm package repository, which can be used to add visualization libraries to the scripting environment.
Each time an instance is generated by Alloy, Sterling automatically executes the script to re-render the custom visualization. This automatic execution continues even as you return to Alloy and modify the model. If the model is changed in a way that causes the visualization script to throw an error, you'll be notified of the error, and the visualization script will not be automatically executed until it has been updated and successfully rerun.
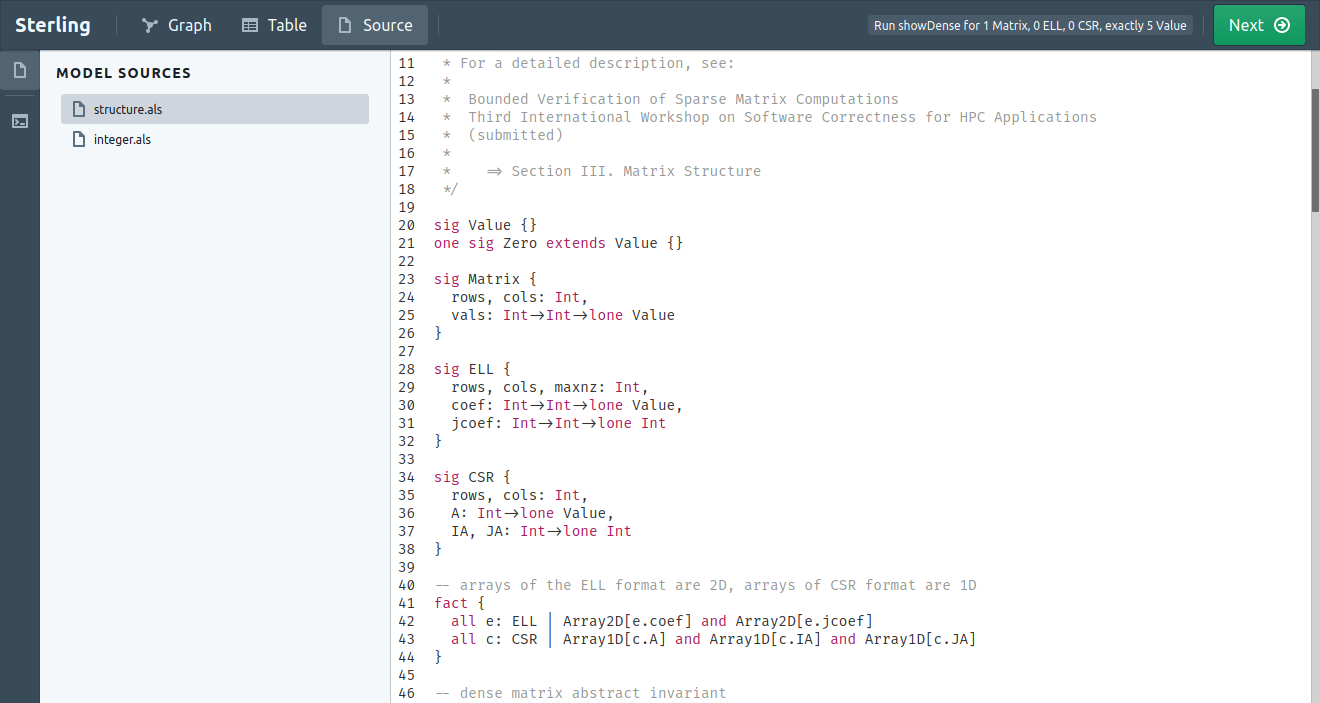
# The Source View
The source view simply provides you with all of the Alloy source files used to generate the currently displayed instance. They are not editable files, and simply serve as a convenient way to refer back to the models.
# The Evaluator
The evaluator is a drawer tool that is accessible from any view by clicking on the terminal icon in the sidebar. It provides the same evaluator functionality that you are used to in Alloy and allows you to toggle between textual and tabular views of the results.