Welcome
Sterling is a web-based visualizer for Alloy, providing enhanced graph and table views in an effort to make instances easier to understand. It is included in a custom build of Alloy, which can be downloaded here.
News
-
Sterling at ABZ 2021
Jun 9th, 2021
We're very pleased to announce that our article titled Sterling: A Web-based Visualizer for Relational Modeling Languages has been published as part of the Lecture Notes in Computer Science book series (LNCS, volume 12709). As part of the International Conference on Rigorous State-Based Methods, we presented our work at ABZ 2021, and the paper can be found here.
-
Sterling 1.1 Release
Jun 7th, 2021
The Sterling 1.0 release is now available. This version introduces the Script View, which provides an environment for the development of custom visualizations of Alloy instances.
Head to the downloads page to down Sterling 1.1.

-
Sterling 1.1 Demo Release
Mar 1st, 2021
The upcoming Sterling 1.1 is now available to demo! This release will introduce the script view, which allows you to develop custom visualization scripts for your instances. Head to the demo page to try out a few sample scripts or try uploading your own instance so that you can write your own.
How to use the Demo Script View
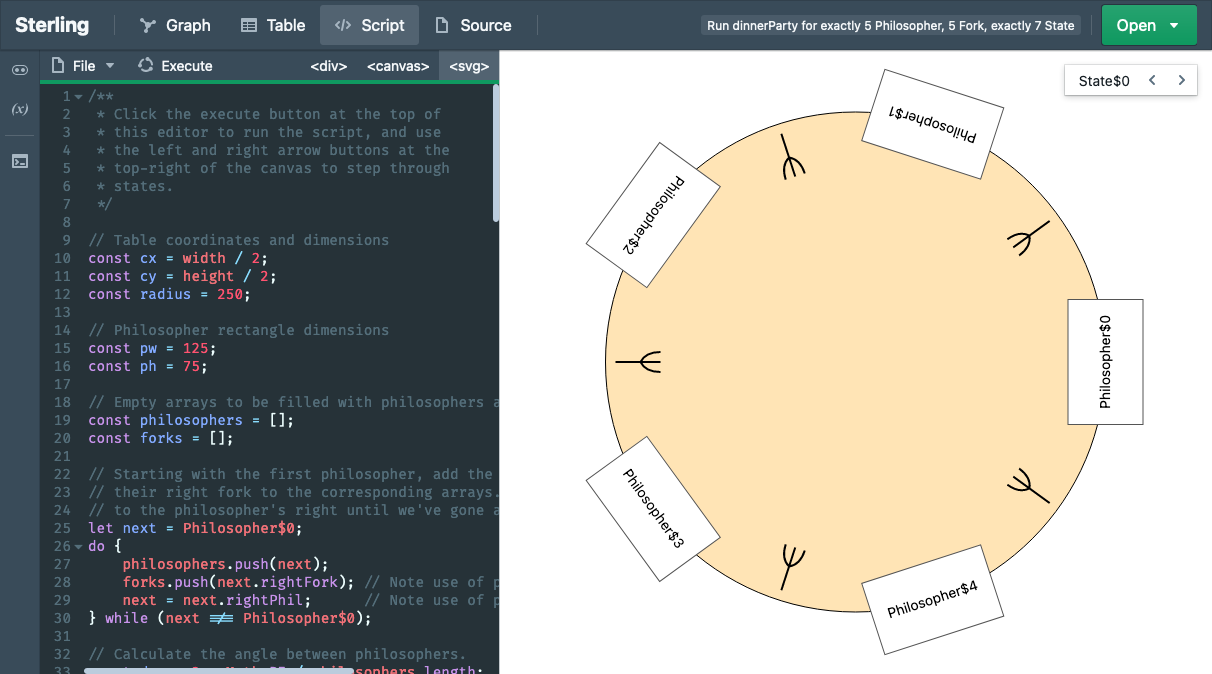
The Sterling 1.1 demo comes preloaded with some example instances and scripts to demonstrate how custom visualizations are generated. The one to the right shows an instance of the dining philosophers problem. To run a demo script, follow these steps:
- Open the demo.
- Open an example instance by clicking the green Open button at the top right. It looks like this:
- Go to the Script View by clicking the Script button in the top navigation bar. The script view contains a script editor on the left and a rendering stage on the right, like you see in the image to the right.
- Execute the preloaded script by clicking the Execute button at the top of the script editor, it looks like this:
- Some instances, like the dining philosophers one, come from stateful models. After executing the script you can use the left and right arrow buttons located at the top-right of the rendering stage to explore how the state changes through time. These buttons look like this:


